
Testing Indoor Air Quality
Nowadays designing a building is a process that takes into account the indoor air quality. Having the right share of fresh air is important to guarantee a healthy environment. The content of pollutants can be decreased by supplying filtered outdoor air through mechanical ventilation systems. Yet still, not all the dwellings are provided with this kind of device even if the indoor environmental quality is a topic that is becoming more and more popular. This new interest is shown in the widespread adoption of certification like WELL, LEED and BREAM.
The Italian residential stock is old: 78% of Italian building stock was built before the first energy efficiency law in 1976 (Law 373) and 89% before Law 10 in 1991 (the first update of Law 373/76). [1] Most of the residential buildings present only natural ventilation. Thus fresh air is provided by openings. The problem with the old stock is controlling the indoor air quality and keeping a good thermo-comfort. Keeping partially open windows during winter does not allow the heating system to reach the setpoint temperature, this approach brings to the same result in summer.
To get the good air quality in a room with “old style” natural ventilation (i.e. windows are designed without considering the direction of airflows) new electronic devices can be used. As mentioned in another article, having clear visual feedback can help the occupant in correcting his / her behavior. I had the chance to try a CO2 meter, its aim is based on the above-mentioned concept. The meter shows a smile according to the condition of the room.
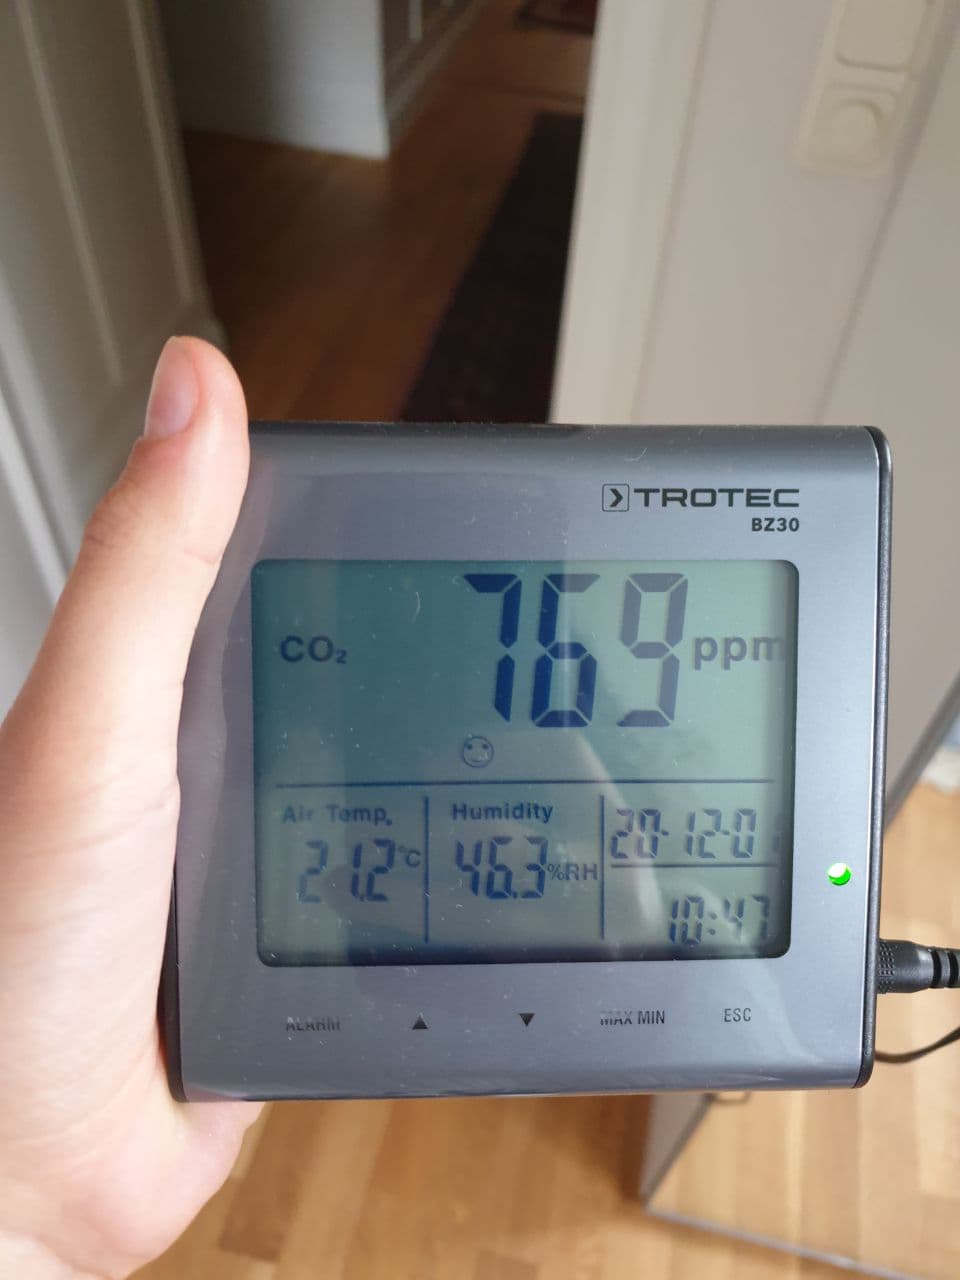
CO2 is an index of the level of pollutants in a room since it is correlated to the occupancy’s breath. The content of CO2 should be below 880 ppm to have a good air quality for occupied areas.
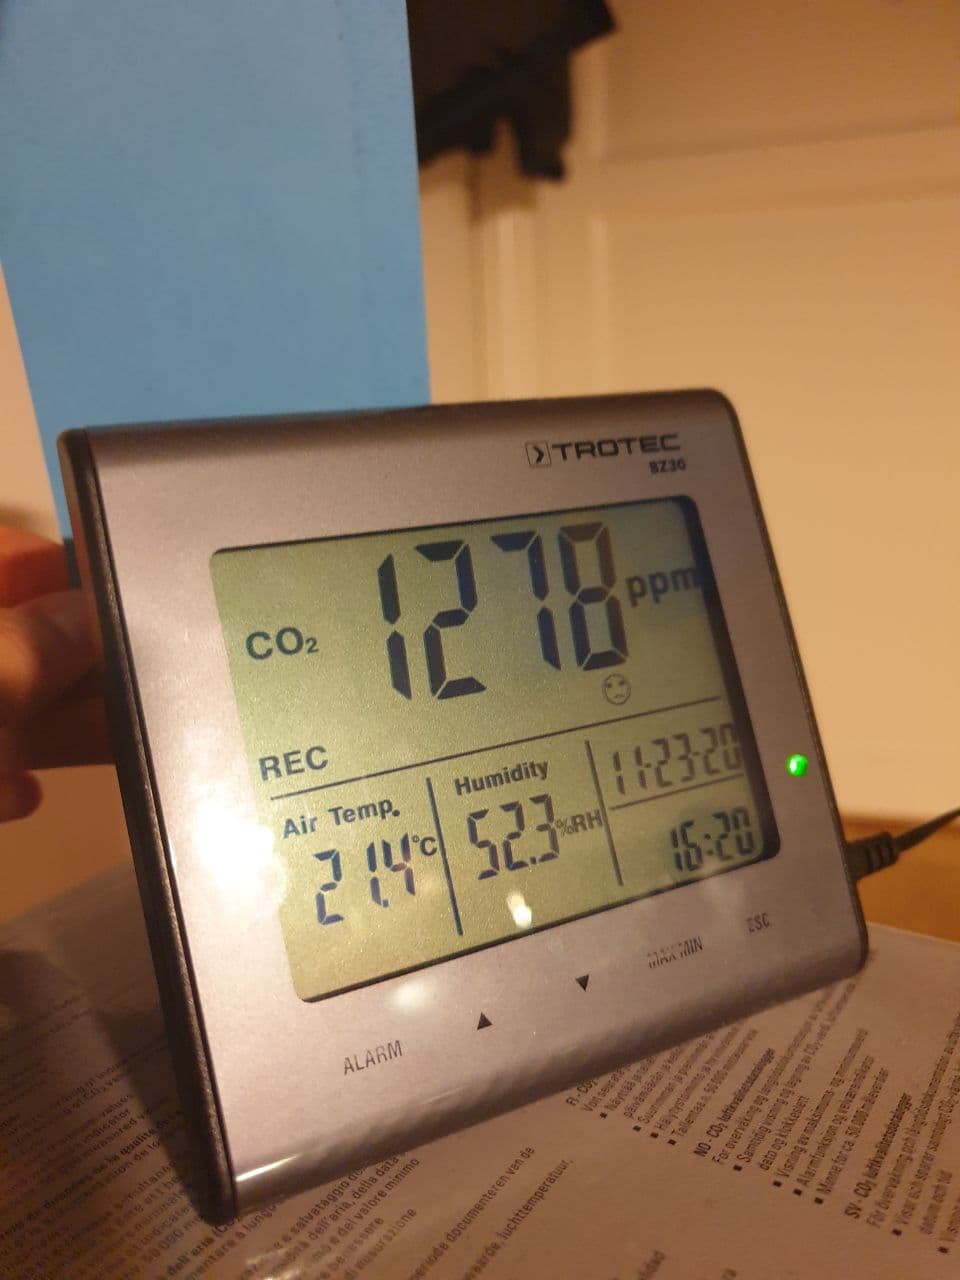
In the experiment the user had to place the meter inside the bedroom. The first week of measurement was carried on by keeping a post-it on the device so the occupancy could not see the actual co2 content. This first week was working as a benchmark period of tenant typical behavior. The second week the post-it was removed from the screen of the meter and the occupant was asked to take actions related to the displayed value. At the end of each week the person was asked to fill a form in which he/she described which actions were taken and how he/she felt during the studied period. The subject was also asked to take notes of symptoms like headaches, tiredness, nose stuffiness, throat and eyes dryness and irritated mood upon awakening.
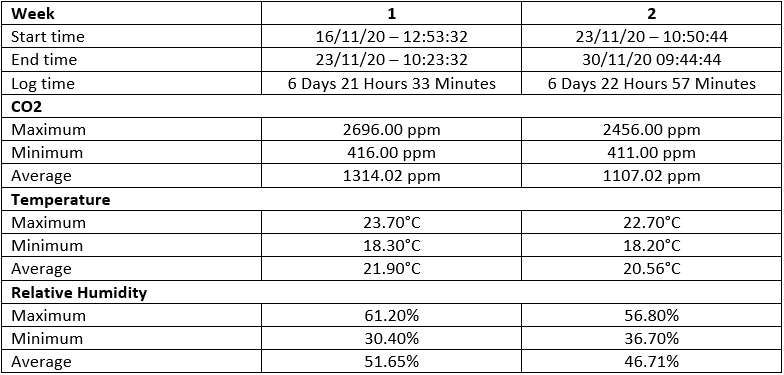
In my personal experience, by looking at the recorded data, there was a substantial difference in the average value of CO2 between the weeks. During week 2 I used to open the windows as soon as I saw a concentration higher than 1000 ppm. So, by looking at the device’s monitor I was able to open windows when it was required, even if at that moment the effects of lack of oxygen were not active on me. By keeping the level of the pollutant low I was able to improve the staying in my bedroom. The frequency of the above-mentioned symptoms decreased and the attention threshold while studying increased.
Even if these results are related to one single person experience, they are corroborated by the huge literature linked to indoor air quality (see also The Effect of Low Ventilation Rates on the Cognitive Function of a Primary School Class). Tools that show the immediate value of CO2 content help the nudging process in involving the occupancy in interacting with the dwelling and increase the everyday life quality. Technology is once again available for improving our living, what is still missing is a holistic culture in existing residential buildings that considers not only the thermal performance but also the air quality, but En-sight blog is working on that.